Monthly Update - June, 2019

Indian markets have corrected sharply post budget. This correction, in our view, provides a fantastic opportunity for the long term investor to increase allocation to equities as an asset class. If one re-computes the index after taking out top 10 stocks, the markets are down by about 10% on an year to year basis. The situation is even worse if you look at mid and small caps. The 2019 budget is negative for ultra-rich in terms of taxation. However, the Finance Minister has given a good provision to increase liquidity in the Indian banking system. Increase in liquidity will lead to a reduction in interest rates. This will in turn increase the margins of leveraged mid and small cap companies.
As per FinAtoZ investment model, this is a very good time to increase allocation to mid and small caps for a 3+ year investment horizon. It is also a very good time to increase allocation to PMS for a similar time horizon.
Lets look at other major events during the last month.
- DHFL default
Dewan Housing Finance Limited(DHFL) delayed the interest payment of 960 crores last month and it hit net asset values of several debt funds. Few debt funds fell by 6%-53%.
- SEBI's measures to reduce the risk of debt mutual funds
SEBI has taken measures to reduce the risk and secure the debt mutual funds investors. The measures are:
- Sectorial limit cut has reduced from 25% to 20%
- Additional exposure to HFCs cut from 15% to 10%.
- Liquid schemes asked to invest at least 20% in G-secs, T- bills
- Exit load on liquid schemes for up to 7 days.
- US-China trade war
The US and China agreed to restart trade talks and holding off new tariffs on Chinese exports, a pause in trade hostilities which is a positive sign globally.
- RBI cut the interest rates
RBI has cut the interest rate further by 25 bps. The current rate is 5.75%.
- Valuations
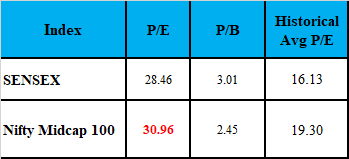
Even if the Sensex valuations looks overvalued, it is only because of top 5 or 6 stocks. The broader market is still undervalued. We will understand this with the help of the below table.
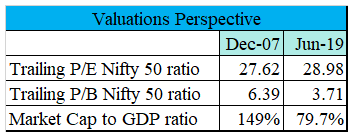
The P/E ratio of Nifty 50 in 2007 was 27.62, and current ratio is 28.98, which is in-fact higher as compared to 2007 valuation. But the P/B ratio and market cap is 50% less compared to the 2007 valuations. Similarly, markets look to be undervalued on the basis of Market cap to GDP ratio. So, though the markets look overvalued on the basis of P/E, the story is different if you consider other two important valuation ratios.
MACROECONOMIC TRENDS
Kindly refer to the below graphs for a summary of major macroeconomic parameters and their respective trends:
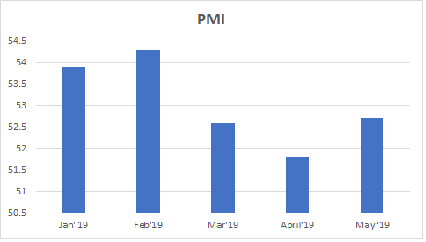
PMI
PMI India rose to a three month high of 52.7 in May from 51.7 in April.
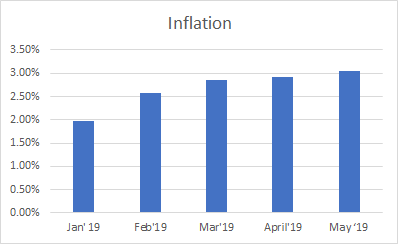
INFLATION
Inflation in India rose to 3.05% in May from 2.9% in the previous month and above the market expectations of 3.01%.
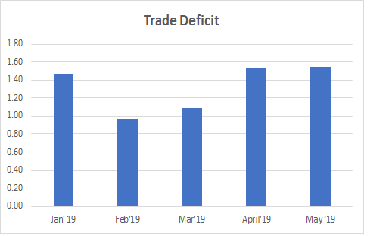
TRADE DEFICIT
India's trade gap widened to USD 15.36 billion in May 2019 from USD 14.62 billion a year earlier and below market expectations of USD 15.84 billion.
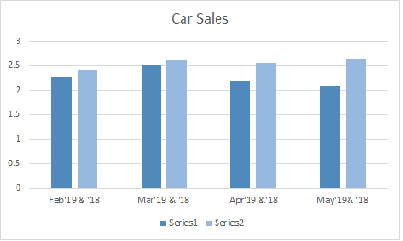
CAR SALES
Car Sales decreased to 2.10 in May from 2.19 in April and 21% y-o -y basis.
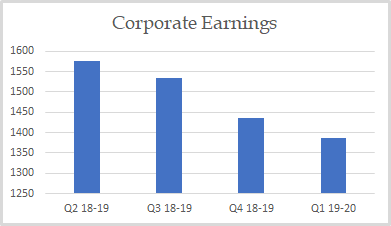
CORPORATE EARNINGS
The corporate earnings are slightly down this quarter compared to the previous quarter.
VALUATION
Markets are fairly valued on the basis of historical P/E as well as P/B basis.
Get Expert Financial Advice
Book an introductory call with our Certified Financial Planner to explore how we can help you achieve your financial goals.
Book Your Appointment

